SeeChart: an unique dashboard
for monitoring oceanographic equipment
The SeeChart dashboard allows you to manage, on a single visualization tool, your entire network of different types of oceanographic observing platforms (buoys, floats,…) using both Argos and Iridium telemetry systems.
Developed as part of the TRUSTED project funded by Copernicus for EUMETSAT, this unique online interface allows location and sensor data to be visualized and compared with satellite data.
As part of the TRUSTED project, SEECHART makes it easy to monitor the data coming from 100+ HR-SST drifting buoys, using Iridium’s SBD services provided by CLS.
Unique dashboard
for monitoring oceanographic equipment
This service is managed by CLS data processing center, monitored 24/7, with active redundancy on 2 separate backup processing centers, to ensure a maximal efficiency and data safety.
- Visualize the position of an unlimited number of oceanographic platforms – using both Argos and Iridium telemetry systems
- Visualize the metadata of the platform
- Visualize sensor data
- Monitor the vital parameters (i.e battery status, etc)
- View & download in-situ tracks with satellite ocean data
- Perform immediate comparison with satellite data
- And much more… this dashboard is fully customizable according to your needs
Why Choose
SeeChart by CLS?
- View data from all of your oceanographic platforms (buoys, profiling floats, gliders…) on one website
- Just one contact for Iridium telemetry services and a value-added data visualization services
- Identify sensor anomalies quickly and easily by comparing values with satellite data
- Tailor-made solution for your needs
Only one online interface
to manage all your oceanographic platforms
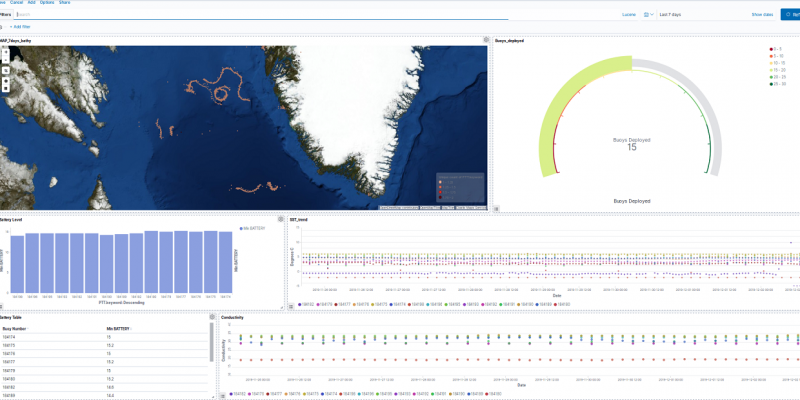
The above screenshot shows the online graphic interface that CLS has developed to monitor oceanographic equipment including drifting buoys, Argo floats, etc. This interface makes it possible to view buoy trajectory data superimposed with satellite-derived SST data, for example.
In addition, information about battery lifetime and signal quality is available. Within the TRUSTED project, the interface makes it easy to compare satellite-derived SST values and the HR SST measurements made by the buoys to identify temperature sensor errors on the buoys quickly in order to apply necessary corrections.
SeeChart Webinar
Check out our webinar held in 2020 offering some helpful tips on how to manage your fleet of satellite platforms with SeeChart, a unique dashboard for monitoring oceanographic equipment.


